The table below lists quarter by quarter business electricity rates (in pence per kWh) from Q1 2004 to Q2 2025 (excluding CCL). Here are the a few key statistics:
- Since 2004 average business electricity prices have increased 538% from 3.72p/kWh to 23.77
p/kWh - The annual prices decreased from Q2 2024 to Q2 2025 by 6.7% YoY from 25.47p/kWh to 23.77p/kWh
- Very Large business energy customers have seen the biggest increase in rates from 2004 to 2025 at 676%%!
- Very small business energy customers saw the largest increase in the last 12 months at 25%, the only group to have an increase.
- Business electricity rates are 28X higher than they were in 1970.
Topics
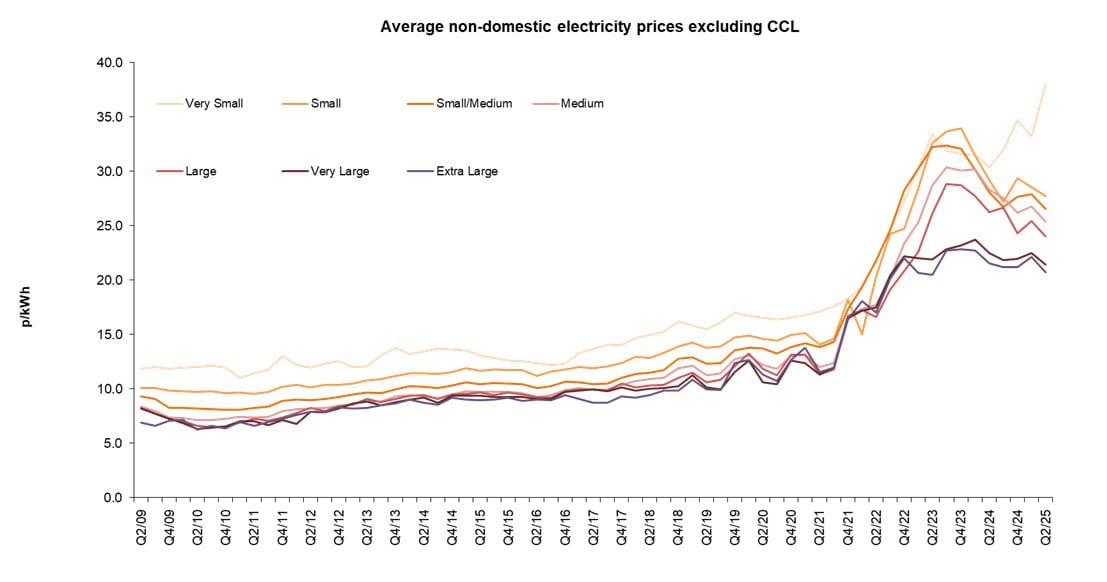
Quarterly Business Electricity Prices (Excluding CCL)
| Year | Quarter | Electricity: Very Small | Electricity: Small | Electricity: Small/Medium | Electricity: Medium | Electricity: Large | Electricity: Very Large | Electricity: Extra Large | Electricity: Average |
|---|---|---|---|---|---|---|---|---|---|
| 2004 | 1st | 5.84 | 5.09 | 3.75 | 3.30 | 3.14 | 2.76 | 3.72 | |
| 2004 | 2nd | 5.91 | 4.91 | 3.82 | 3.30 | 3.04 | 2.65 | 3.59 | |
| 2004 | 3rd | 6.07 | 4.43 | 3.59 | 3.39 | 3.39 | 2.93 | 3.66 | |
| 2004 | 4th | 6.14 | 5.35 | 4.51 | 3.97 | 3.93 | 3.63 | 4.46 | |
| 2005 | 1st | 6.29 | 5.57 | 4.91 | 4.27 | 4.10 | 3.63 | 4.57 | |
| 2005 | 2nd | 6.56 | 5.57 | 4.91 | 4.25 | 4.06 | 3.68 | 4.60 | |
| 2005 | 3rd | 6.79 | 5.74 | 5.09 | 4.36 | 4.08 | 3.88 | 4.74 | |
| 2005 | 4th | 6.98 | 6.32 | 6.06 | 5.53 | 5.04 | 4.58 | 5.52 | |
| 2006 | 1st | 7.30 | 6.54 | 6.66 | 5.98 | 5.88 | 5.00 | 6.09 | |
| 2006 | 2nd | 7.88 | 6.66 | 6.48 | 5.91 | 5.65 | 5.01 | 6.10 | |
| 2006 | 3rd | 8.53 | 7.04 | 6.60 | 5.85 | 5.68 | 5.03 | 6.24 | |
| 2006 | 4th | 9.10 | 7.76 | 7.73 | 6.97 | 6.56 | 5.49 | 7.03 | |
| 2007 | 1st | 9.27 | 7.97 | 7.75 | 7.00 | 6.61 | 6.69 | 6.32 | 7.39 |
| 2007 | 2nd | 9.57 | 7.29 | 6.59 | 6.23 | 5.74 | 5.62 | 4.76 | 6.49 |
| 2007 | 3rd | 9.67 | 7.99 | 7.20 | 6.26 | 5.92 | 5.63 | 4.19 | 6.63 |
| 2007 | 4th | 9.67 | 8.09 | 7.15 | 6.32 | 6.01 | 5.81 | 5.35 | 6.87 |
| 2008 | 1st | 9.75 | 8.26 | 7.26 | 6.37 | 6.28 | 6.46 | 5.65 | 7.12 |
| 2008 | 2nd | 9.86 | 8.28 | 7.26 | 6.73 | 6.61 | 6.86 | 6.15 | 7.43 |
| 2008 | 3rd | 10.45 | 8.81 | 7.76 | 7.18 | 7.01 | 7.11 | 6.30 | 7.81 |
| 2008 | 4th | 11.29 | 9.77 | 9.77 | 9.23 | 8.84 | 9.36 | 7.67 | 9.45 |
| 2009 | 1st | 11.87 | 10.04 | 9.14 | 8.24 | 8.08 | 8.00 | 7.07 | 9.06 |
| 2009 | 2nd | 11.86 | 10.05 | 9.33 | 8.36 | 8.23 | 8.18 | 6.89 | 9.13 |
| 2009 | 3rd | 12.05 | 10.11 | 9.06 | 7.98 | 7.73 | 7.72 | 6.61 | 8.85 |
| 2009 | 4th | 11.87 | 9.84 | 8.25 | 7.40 | 7.26 | 7.23 | 7.06 | 8.56 |
| 2010 | 1st | 11.97 | 9.78 | 8.24 | 7.30 | 7.04 | 6.83 | 7.11 | 8.47 |
| 2010 | 2nd | 12.02 | 9.70 | 8.17 | 7.11 | 6.59 | 6.34 | 6.24 | 8.15 |
| 2010 | 3rd | 12.14 | 9.78 | 8.15 | 7.16 | 6.50 | 6.43 | 6.64 | 8.21 |
| 2010 | 4th | 11.94 | 9.59 | 8.07 | 7.27 | 6.56 | 6.57 | 6.40 | 8.14 |
| 2011 | 1st | 11.01 | 9.65 | 8.09 | 7.46 | 6.93 | 7.03 | 6.96 | 8.13 |
| 2011 | 2nd | 11.41 | 9.56 | 8.23 | 7.40 | 7.24 | 7.01 | 6.58 | 8.06 |
| 2011 | 3rd | 11.78 | 9.75 | 8.39 | 7.46 | 7.07 | 6.64 | 6.98 | 8.12 |
| 2011 | 4th | 13.04 | 10.22 | 8.92 | 7.99 | 7.39 | 7.14 | 7.26 | 8.68 |
| 2012 | 1st | 12.20 | 10.36 | 9.05 | 8.11 | 7.78 | 6.80 | 7.62 | 8.90 |
| 2012 | 2nd | 11.96 | 10.14 | 8.95 | 8.18 | 8.26 | 7.91 | 7.92 | 8.85 |
| 2012 | 3rd | 12.30 | 10.39 | 9.08 | 8.27 | 7.99 | 7.84 | 7.86 | 8.84 |
| 2012 | 4th | 12.52 | 10.40 | 9.24 | 8.46 | 8.41 | 8.20 | 8.29 | 9.17 |
| 2013 | 1st | 12.03 | 10.52 | 9.48 | 8.62 | 8.55 | 8.65 | 8.19 | 9.29 |
| 2013 | 2nd | 12.09 | 10.79 | 9.65 | 8.82 | 9.06 | 8.84 | 8.26 | 9.46 |
| 2013 | 3rd | 13.07 | 10.89 | 9.63 | 8.82 | 8.80 | 8.50 | 8.51 | 9.45 |
| 2013 | 4th | 13.81 | 11.19 | 9.96 | 9.34 | 9.06 | 8.77 | 8.68 | 9.92 |
| 2014 | 1st | 13.20 | 11.44 | 10.28 | 9.46 | 9.39 | 9.02 | 9.03 | 10.06 |
| 2014 | 2nd | 13.42 | 11.42 | 10.19 | 9.30 | 9.46 | 9.19 | 8.74 | 9.94 |
| 2014 | 3rd | 13.72 | 11.36 | 10.08 | 9.12 | 9.06 | 8.70 | 8.56 | 9.85 |
| 2014 | 4th | 13.60 | 11.53 | 10.34 | 9.52 | 9.50 | 9.39 | 9.18 | 10.18 |
| 2015 | 1st | 13.53 | 11.92 | 10.59 | 9.81 | 9.56 | 9.39 | 9.03 | 10.35 |
| 2015 | 2nd | 13.06 | 11.68 | 10.42 | 9.72 | 9.66 | 9.37 | 8.98 | 10.18 |
| 2015 | 3rd | 12.85 | 11.81 | 10.56 | 9.75 | 9.41 | 9.28 | 9.03 | 10.16 |
| 2015 | 4th | 12.60 | 11.73 | 10.47 | 9.70 | 9.66 | 9.27 | 9.19 | 10.24 |
| 2016 | 1st | 12.56 | 11.71 | 10.41 | 9.63 | 9.48 | 9.27 | 8.88 | 10.17 |
| 2016 | 2nd | 12.39 | 11.21 | 10.07 | 9.27 | 9.27 | 9.07 | 9.04 | 9.92 |
| 2016 | 3rd | 12.22 | 11.59 | 10.27 | 9.44 | 9.23 | 9.06 | 8.96 | 9.99 |
| 2016 | 4th | 12.31 | 11.78 | 10.66 | 9.92 | 9.79 | 9.71 | 9.41 | 10.43 |
| 2017 | 1st | 13.34 | 12.00 | 10.63 | 10.06 | 9.98 | 9.84 | 9.07 | 10.55 |
| 2017 | 2nd | 13.67 | 11.91 | 10.43 | 9.90 | 9.96 | 9.96 | 8.72 | 10.38 |
| 2017 | 3rd | 14.06 | 12.07 | 10.52 | 9.96 | 9.84 | 9.77 | 8.73 | 10.38 |
| 2017 | 4th | 14.03 | 12.35 | 11.01 | 10.39 | 10.49 | 10.17 | 9.29 | 10.89 |
| 2018 | 1st | 14.64 | 12.94 | 11.38 | 10.72 | 10.16 | 9.85 | 9.18 | 11.06 |
| 2018 | 2nd | 14.97 | 12.84 | 11.49 | 10.89 | 10.33 | 10.00 | 9.43 | 11.12 |
| 2018 | 3rd | 15.26 | 13.32 | 11.75 | 11.03 | 10.39 | 10.09 | 9.83 | 11.35 |
| 2018 | 4th | 16.18 | 13.93 | 12.81 | 11.91 | 11.00 | 10.26 | 9.87 | 11.94 |
| 2019 | 1st | 15.85 | 14.27 | 12.88 | 12.12 | 11.49 | 11.28 | 10.84 | 12.42 |
| 2019 | 2nd | 15.49 | 13.76 | 12.31 | 11.25 | 10.64 | 10.13 | 9.94 | 11.61 |
| 2019 | 3rd | 16.12 | 13.91 | 12.38 | 11.46 | 10.85 | 9.97 | 9.92 | 11.68 |
| 2019 | 4th | 17.04 | 14.75 | 13.55 | 12.75 | 12.06 | 11.53 | 12.39 | 13.25 |
| 2020 | 1st | 16.75 | 14.89 | 13.79 | 13.09 | 13.25 | 12.63 | 12.65 | 13.66 |
| 2020 | 2nd | 16.54 | 14.59 | 13.75 | 12.18 | 11.85 | 10.60 | 11.31 | 12.70 |
| 2020 | 3rd | 16.37 | 14.42 | 13.24 | 11.85 | 11.28 | 10.41 | 10.74 | 12.22 |
| 2020 | 4th | 16.58 | 14.95 | 13.84 | 13.02 | 13.15 | 12.61 | 12.65 | 13.56 |
| 2021 | 1st | 16.80 | 15.12 | 14.19 | 13.12 | 13.13 | 12.35 | 13.80 | 14.09 |
| 2021 | 2nd | 17.13 | 14.09 | 13.85 | 12.01 | 11.40 | 11.29 | 11.52 | 12.87 |
| 2021 | 3rd | 17.60 | 14.62 | 14.31 | 12.35 | 11.81 | 11.94 | 11.96 | 13.22 |
| 2021 | 4th | 18.27 | 18.20 | 17.33 | 16.51 | 16.74 | 16.51 | 16.38 | 17.04 |
| 2022 | 1st | 19.44 | 15.05 | 19.39 | 17.39 | 17.26 | 17.22 | 18.10 | 17.45 |
| 2022 | 2nd | 21.79 | 20.32 | 21.77 | 17.75 | 16.60 | 17.49 | 17.05 | 18.63 |
| 2022 | 3rd | 24.65 | 24.27 | 24.58 | 20.23 | 19.11 | 20.41 | 20.17 | 21.52 |
| 2022 | 4th | 27.25 | 24.71 | 28.24 | 23.36 | 20.87 | 22.21 | 22.05 | 24.06 |
| 2023 | 1st | 30.34 | 28.44 | 30.28 | 25.30 | 22.63 | 22.01 | 20.68 | 24.83 |
| 2023 | 2nd | 33.41 | 32.59 | 32.29 | 28.70 | 26.16 | 21.91 | 20.49 | 26.34 |
| 2023 | 3rd | 31.89 | 33.69 | 32.38 | 30.41 | 28.84 | 22.86 | 22.70 | 27.81 |
| 2023 | 4th | 31.60 | 33.95 | 32.11 | 30.09 | 28.74 | 23.18 | 22.87 | 27.90 |
| 2024 | 1st | 31.57 | 31.42 | 30.12 | 30.23 | 27.71 | 23.74 | 22.76 | 27.31 |
| 2024 | 2nd | 30.38 | 29.18 | 28.09 | 28.30 | 26.24 | 22.51 | 21.54 | 25.47 |
| 2024 | 3rd | 31.99 | 27.20 | 26.73 | 27.57 | 26.67 | 21.84 | 21.22 | 25.15 |
| 2024 | 4th | 34.72 | 29.36 | 27.69 | 26.23 | 24.35 | 21.98 | 21.20 | 24.98 |
| 2025 | 1st | 33.18 | 28.54 | 27.90 | 26.79 | 25.42 | 22.49 | 22.16 | 25.33 |
| 2025 | 2nd | 38.05 | 27.71 | 26.53 | 25.37 | 24.02 | 21.41 | 20.70 | 23.77 |
Note business elasticity prices listed above are in pence per kWh. And come from Gov.uk
Quarterly Business Electricity Price Chart (Excluding CCL)
Average Annual Business Electricity Prices (Excluding CCL)
| Year | Electricity: Very Small | Electricity: Small | Electricity: Small/Medium | Electricity: Medium | Electricity: Large | Electricity: Very Large | Electricity: Extra Large | Electricity: Average |
|---|---|---|---|---|---|---|---|---|
| 2004 | 6.00 | 4.96 | 3.89 | 3.48 | 3.36 | 3.00 | 3.87 | |
| 2005 | 6.66 | 5.81 | 5.25 | 4.61 | 4.31 | 3.95 | 4.87 | |
| 2006 | 8.16 | 7.00 | 6.87 | 6.17 | 5.95 | 5.13 | 6.37 | |
| 2007 | 9.54 | 7.83 | 7.19 | 6.45 | 6.07 | 5.94 | 5.15 | 6.85 |
| 2008 | 10.38 | 8.77 | 8.00 | 7.36 | 7.14 | 7.35 | 6.39 | 7.93 |
| 2009 | 11.87 | 10.04 | 9.14 | 8.24 | 8.08 | 8.00 | 7.07 | 9.06 |
| 2010 | 12.01 | 9.72 | 8.16 | 7.21 | 6.68 | 6.54 | 6.60 | 8.25 |
| 2011 | 11.79 | 9.81 | 8.40 | 7.57 | 7.15 | 6.95 | 6.94 | 8.28 |
| 2012 | 12.25 | 10.33 | 9.08 | 8.25 | 8.12 | 7.71 | 7.96 | 8.94 |
| 2013 | 12.67 | 10.87 | 9.68 | 8.88 | 8.94 | 8.73 | 8.42 | 9.52 |
| 2014 | 13.47 | 11.44 | 10.22 | 9.36 | 9.37 | 9.09 | 8.90 | 10.01 |
| 2015 | 13.02 | 11.79 | 10.51 | 9.75 | 9.57 | 9.33 | 9.06 | 10.24 |
| 2016 | 12.39 | 11.58 | 10.36 | 9.57 | 9.44 | 9.28 | 9.07 | 10.13 |
| 2017 | 13.75 | 12.08 | 10.65 | 10.08 | 10.07 | 9.93 | 8.96 | 10.55 |
| 2018 | 15.23 | 13.24 | 11.84 | 11.14 | 10.47 | 10.05 | 9.58 | 11.36 |
| 2019 | 16.11 | 14.19 | 12.79 | 11.90 | 11.27 | 10.76 | 10.77 | 12.26 |
| 2020 | 16.58 | 14.74 | 13.66 | 12.58 | 12.44 | 11.71 | 11.88 | 12.81 |
| 2021 | 17.39 | 15.53 | 15.03 | 13.60 | 13.38 | 13.14 | 13.48 | 14.38 |
| 2022 | 23.21 | 19.36 | 23.28 | 19.50 | 18.39 | 19.34 | 19.13 | 20.16 |
| 2023 | 31.68 | 32.10 | 31.69 | 28.47 | 26.52 | 22.48 | 21.68 | |
| 2024 | 31.98 | 29.16 | 28.30 | 28.18 | 26.23 | 22.50 | 21.70 |
Note business elasticity prices listed above are in pence per kWh. And come from Gov.uk
Annual Consumption Bands for Electricity
The table below shows how business energy costumers are defined based on annual electricity consumption.
| Electricity: Bands Name | Electricity: Annual consumption MWh |
|---|---|
| Very Small | 0 - 20 |
| Small | 20 - 499 |
| Small/Medium | 500 - 1,999 |
| Medium | 2,000 - 19,999 |
| Large | 20,000 - 69,999 |
| Very Large | 70,000 - 150,000 |
| Extra Large | >150,000 |
Notes: The average price for each size of consumer is obtained by dividing the total quantity of purchases, for each fuel, into their total value. Prices shown are fully delivered prices, including all elements except VAT. The average electricity price from Q1 2007 includes the new Extra Large sizeband, introducing a discontinuity with the averages for previous quarters.
Historic & Current CCL Rates for Electricity
The Climate Change Levy (CCL) came into effect in April 2001. The CCL rates for electricity and gas from 2001 are shown in table below. More information is available on the HM Revenue and Customs website.
| Year | Electricity |
|---|---|
| Apr-2001 | 0.430p/kWh |
| Apr-2007 | 0.441p/kWh |
| Apr-2008 | 0.456 p/kWh |
| Apr-2009 | 0.470 p/kWh |
| Apr-2011 | 0.485 p/kWh |
| Apr-2012 | 0.509 p/kWh |
| Apr-2013 | 0.524 p/kWh |
| Apr-2014 | 0.541 p/kWh |
| Apr-2015 | 0.554 p/kWh |
| Apr-2016 | 0.559 p/kWh |
| Apr-2017 | 0.568 p/kWh |
| Apr-2018 | 0.583 p/kWh |
| Apr-2019 | 0.847 p/kWh |
| Apr-2020 | 0.811 p/kWh |
| Apr-2021 | 0.775 p/kWh |
| Apr-2022 | 0.775 p/kWh |
| Apr-2023 | 0.775 p/kWh |
| Apr-2024 | 0.775 p/kWh |
| Apr-2025 | 0.775 p/kWh |
| Apr-2026 | 0.801 p/kWh |
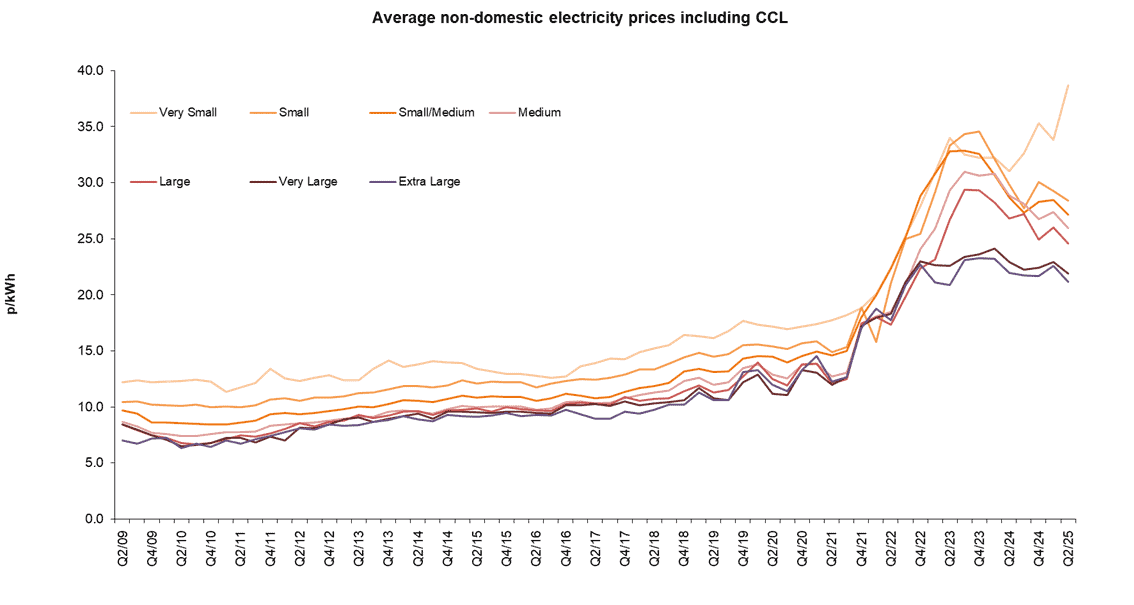
Quarterly Business Electricity Prices (Including CCL)
| Year | Quarter | Electricity: Very Small | Electricity: Small | Electricity: Small/Medium | Electricity: Medium | Electricity: Large | Electricity: Very Large | Electricity: Extra Large | Electricity: Average |
|---|---|---|---|---|---|---|---|---|---|
| 2004 | 1st | 6.04 | 5.49 | 4.14 | 3.64 | 3.38 | 2.98 | 4.02 | |
| 2004 | 2nd | 6.13 | 5.31 | 4.21 | 3.65 | 3.30 | 2.86 | 3.89 | |
| 2004 | 3rd | 6.39 | 4.76 | 3.93 | 3.73 | 3.68 | 3.11 | 3.95 | |
| 2004 | 4th | 6.44 | 5.72 | 4.90 | 4.28 | 4.19 | 3.81 | 4.74 | |
| 2005 | 1st | 6.61 | 5.93 | 5.27 | 4.56 | 4.30 | 3.84 | 4.85 | |
| 2005 | 2nd | 6.88 | 5.95 | 5.28 | 4.57 | 4.28 | 3.89 | 4.89 | |
| 2005 | 3rd | 7.10 | 6.12 | 5.45 | 4.68 | 4.29 | 4.10 | 5.02 | |
| 2005 | 4th | 7.30 | 6.69 | 6.44 | 5.85 | 5.25 | 4.82 | 5.81 | |
| 2006 | 1st | 7.61 | 6.89 | 7.03 | 6.30 | 6.10 | 5.32 | 6.41 | |
| 2006 | 2nd | 8.16 | 7.04 | 6.85 | 6.23 | 5.88 | 5.33 | 6.42 | |
| 2006 | 3rd | 8.81 | 7.41 | 6.96 | 6.16 | 5.90 | 5.35 | 6.56 | |
| 2006 | 4th | 9.38 | 8.13 | 8.09 | 7.29 | 6.78 | 5.82 | 7.35 | |
| 2007 | 1st | 9.53 | 8.30 | 8.05 | 7.26 | 6.77 | 6.82 | 6.44 | 7.64 |
| 2007 | 2nd | 9.85 | 7.65 | 6.91 | 6.52 | 5.93 | 5.77 | 4.86 | 6.75 |
| 2007 | 3rd | 9.92 | 8.34 | 7.51 | 6.53 | 6.09 | 5.78 | 4.31 | 6.88 |
| 2007 | 4th | 9.93 | 8.44 | 7.45 | 6.57 | 6.18 | 5.96 | 5.48 | 7.12 |
| 2008 | 1st | 10.02 | 8.60 | 7.55 | 6.62 | 6.44 | 6.61 | 5.77 | 7.36 |
| 2008 | 2nd | 10.17 | 8.65 | 7.59 | 7.03 | 6.81 | 7.07 | 6.27 | 7.71 |
| 2008 | 3rd | 10.76 | 9.20 | 8.10 | 7.47 | 7.21 | 7.33 | 6.41 | 8.09 |
| 2008 | 4th | 11.60 | 10.13 | 10.07 | 9.50 | 9.03 | 9.58 | 7.78 | 9.71 |
| 2009 | 1st | 12.19 | 10.41 | 9.49 | 8.54 | 8.29 | 8.23 | 7.18 | 9.35 |
| 2009 | 2nd | 12.18 | 10.43 | 9.70 | 8.67 | 8.45 | 8.42 | 7.00 | 9.43 |
| 2009 | 3rd | 12.35 | 10.48 | 9.39 | 8.27 | 7.94 | 7.97 | 6.71 | 9.13 |
| 2009 | 4th | 12.18 | 10.22 | 8.62 | 7.71 | 7.48 | 7.47 | 7.18 | 8.85 |
| 2010 | 1st | 12.26 | 10.17 | 8.60 | 7.60 | 7.26 | 7.06 | 7.24 | 8.77 |
| 2010 | 2nd | 12.30 | 10.09 | 8.52 | 7.41 | 6.80 | 6.51 | 6.33 | 8.43 |
| 2010 | 3rd | 12.42 | 10.18 | 8.48 | 7.43 | 6.68 | 6.61 | 6.71 | 8.48 |
| 2010 | 4th | 12.23 | 9.99 | 8.43 | 7.58 | 6.76 | 6.77 | 6.46 | 8.42 |
| 2011 | 1st | 11.36 | 10.06 | 8.46 | 7.77 | 7.15 | 7.22 | 7.02 | 8.42 |
| 2011 | 2nd | 11.74 | 9.97 | 8.61 | 7.74 | 7.48 | 7.25 | 6.70 | 8.37 |
| 2011 | 3rd | 12.11 | 10.17 | 8.79 | 7.81 | 7.32 | 6.86 | 7.11 | 8.44 |
| 2011 | 4th | 13.37 | 10.64 | 9.32 | 8.33 | 7.62 | 7.36 | 7.39 | 9.00 |
| 2012 | 1st | 12.54 | 10.78 | 9.45 | 8.46 | 8.02 | 7.00 | 7.76 | 9.22 |
| 2012 | 2nd | 12.29 | 10.55 | 9.34 | 8.53 | 8.55 | 8.16 | 8.08 | 9.16 |
| 2012 | 3rd | 12.62 | 10.80 | 9.48 | 8.62 | 8.26 | 8.08 | 7.99 | 9.14 |
| 2012 | 4th | 12.85 | 10.80 | 9.60 | 8.78 | 8.66 | 8.45 | 8.43 | 9.46 |
| 2013 | 1st | 12.35 | 10.95 | 9.82 | 8.93 | 8.80 | 8.89 | 8.31 | 9.57 |
| 2013 | 2nd | 12.38 | 11.21 | 10.01 | 9.13 | 9.27 | 9.04 | 8.38 | 9.73 |
| 2013 | 3rd | 13.40 | 11.30 | 9.99 | 9.10 | 8.99 | 8.67 | 8.63 | 9.70 |
| 2013 | 4th | 14.16 | 11.56 | 10.29 | 9.55 | 9.21 | 8.94 | 8.81 | 10.16 |
| 2014 | 1st | 13.55 | 11.84 | 10.62 | 9.70 | 9.55 | 9.20 | 9.16 | 10.31 |
| 2014 | 2nd | 13.78 | 11.83 | 10.55 | 9.56 | 9.65 | 9.39 | 8.87 | 10.20 |
| 2014 | 3rd | 14.08 | 11.76 | 10.46 | 9.41 | 9.29 | 8.94 | 8.72 | 10.14 |
| 2014 | 4th | 13.96 | 11.94 | 10.72 | 9.79 | 9.69 | 9.55 | 9.31 | 10.45 |
| 2015 | 1st | 13.90 | 12.35 | 10.98 | 10.08 | 9.73 | 9.56 | 9.16 | 10.62 |
| 2015 | 2nd | 13.41 | 12.10 | 10.82 | 9.99 | 9.84 | 9.55 | 9.13 | 10.46 |
| 2015 | 3rd | 13.19 | 12.24 | 10.96 | 10.04 | 9.60 | 9.48 | 9.23 | 10.45 |
| 2015 | 4th | 12.96 | 12.18 | 10.91 | 10.05 | 9.95 | 9.57 | 9.46 | 10.59 |
| 2016 | 1st | 12.94 | 12.18 | 10.87 | 10.01 | 9.79 | 9.59 | 9.15 | 10.54 |
| 2016 | 2nd | 12.76 | 11.71 | 10.56 | 9.72 | 9.67 | 9.44 | 9.31 | 10.33 |
| 2016 | 3rd | 12.58 | 12.09 | 10.77 | 9.88 | 9.60 | 9.41 | 9.21 | 10.39 |
| 2016 | 4th | 12.69 | 12.30 | 11.17 | 10.41 | 10.26 | 10.16 | 9.76 | 10.88 |
| 2017 | 1st | 13.60 | 12.50 | 10.98 | 10.46 | 10.35 | 10.17 | 9.35 | 10.91 |
| 2017 | 2nd | 13.93 | 12.44 | 10.78 | 10.31 | 10.33 | 10.26 | 8.96 | 10.74 |
| 2017 | 3rd | 14.30 | 12.59 | 10.88 | 10.37 | 10.20 | 10.10 | 8.97 | 10.74 |
| 2017 | 4th | 14.27 | 12.86 | 11.36 | 10.80 | 10.88 | 10.47 | 9.55 | 11.26 |
| 2018 | 1st | 14.87 | 13.36 | 11.70 | 11.08 | 10.52 | 10.14 | 9.41 | 11.38 |
| 2018 | 2nd | 15.20 | 13.33 | 11.84 | 11.29 | 10.73 | 10.34 | 9.75 | 11.49 |
| 2018 | 3rd | 15.51 | 13.84 | 12.13 | 11.44 | 10.78 | 10.43 | 10.18 | 11.74 |
| 2018 | 4th | 16.45 | 14.44 | 13.18 | 12.31 | 11.38 | 10.58 | 10.19 | 12.32 |
| 2019 | 1st | 16.33 | 14.80 | 13.42 | 12.61 | 11.93 | 11.70 | 11.30 | 12.90 |
| 2019 | 2nd | 16.16 | 14.49 | 13.10 | 11.95 | 11.27 | 10.75 | 10.60 | 12.30 |
| 2019 | 3rd | 16.77 | 14.70 | 13.18 | 12.20 | 11.49 | 10.61 | 10.61 | 12.40 |
| 2019 | 4th | 17.65 | 15.51 | 14.30 | 13.45 | 12.73 | 12.17 | 13.11 | 13.96 |
| 2020 | 1st | 17.34 | 15.58 | 14.51 | 13.80 | 13.95 | 12.88 | 13.30 | 14.30 |
| 2020 | 2nd | 17.14 | 15.39 | 14.51 | 12.89 | 12.51 | 11.17 | 11.98 | 13.39 |
| 2020 | 3rd | 16.94 | 15.15 | 13.95 | 12.53 | 11.93 | 11.04 | 11.38 | 12.88 |
| 2020 | 4th | 17.17 | 15.70 | 14.56 | 13.71 | 13.81 | 13.29 | 13.31 | 14.25 |
| 2021 | 1st | 17.41 | 15.84 | 14.91 | 13.84 | 13.86 | 13.05 | 14.53 | 14.81 |
| 2021 | 2nd | 17.74 | 14.85 | 14.57 | 12.72 | 12.08 | 11.97 | 12.23 | 13.58 |
| 2021 | 3rd | 18.18 | 15.33 | 15.02 | 13.04 | 12.50 | 12.64 | 12.65 | 13.91 |
| 2021 | 4th | 18.84 | 18.89 | 18.04 | 17.22 | 17.44 | 17.22 | 17.07 | 17.73 |
| 2022 | 1st | 20.06 | 15.80 | 19.95 | 18.09 | 18.01 | 17.95 | 18.78 | 18.14 |
| 2022 | 2nd | 22.42 | 21.05 | 22.34 | 18.47 | 17.34 | 18.28 | 17.74 | 19.33 |
| 2022 | 3rd | 25.27 | 24.99 | 25.15 | 20.94 | 19.86 | 21.17 | 20.85 | 22.20 |
| 2022 | 4th | 27.87 | 25.43 | 28.79 | 24.07 | 22.35 | 22.95 | 22.69 | 24.80 |
| 2023 | 1st | 30.93 | 29.12 | 30.79 | 25.88 | 23.18 | 22.62 | 21.09 | 25.37 |
| 2023 | 2nd | 34.01 | 33.29 | 32.81 | 29.30 | 26.70 | 22.56 | 20.88 | 26.88 |
| 2023 | 3rd | 32.49 | 34.35 | 32.86 | 30.97 | 29.38 | 23.39 | 23.10 | 28.32 |
| 2023 | 4th | 32.21 | 34.57 | 32.54 | 30.62 | 29.29 | 23.62 | 23.27 | 28.39 |
| 2024 | 1st | 32.22 | 32.09 | 30.70 | 30.79 | 28.25 | 24.15 | 23.19 | 27.84 |
| 2024 | 2nd | 31.02 | 29.84 | 28.66 | 28.85 | 26.79 | 22.93 | 21.97 | 25.99 |
| 2024 | 3rd | 32.62 | 27.72 | 27.31 | 28.13 | 27.20 | 22.23 | 21.73 | 25.67 |
| 2024 | 4th | 35.29 | 30.06 | 28.26 | 26.77 | 24.91 | 22.41 | 21.64 | 25.50 |
| 2025 | 1st | 33.80 | 29.25 | 28.48 | 27.35 | 25.98 | 22.91 | 22.61 | 25.87 |
| 2025 | 2nd | 38.64 | 28.41 | 27.12 | 25.92 | 24.58 | 21.87 | 21.14 | 24.29 |
Note business elasticity prices listed above are in pence per kWh. And come from Gov.uk
Quarterly Business Electricity Price Chart (Including CCL)
Average Annual Business Electricity Prices (Including CCL)
| Year | Electricity: Very Small | Electricity: Small | Electricity: Small/Medium | Electricity: Medium | Electricity: Large | Electricity: Very Large | Electricity: Extra Large | Electricity: Average |
|---|---|---|---|---|---|---|---|---|
| 2004 | 6.27 | 5.34 | 4.27 | 3.82 | 3.62 | 3.20 | 4.16 | |
| 2005 | 6.97 | 6.18 | 5.62 | 4.92 | 4.53 | 4.18 | 5.15 | |
| 2006 | 8.45 | 7.37 | 7.23 | 6.49 | 6.18 | 5.46 | 6.69 | |
| 2007 | 9.80 | 8.18 | 7.50 | 6.72 | 6.24 | 6.09 | 5.26 | 7.10 |
| 2008 | 10.68 | 9.13 | 8.32 | 7.64 | 7.33 | 7.55 | 6.51 | 8.20 |
| 2009 | 12.19 | 10.44 | 9.49 | 8.54 | 8.29 | 8.23 | 7.18 | 9.36 |
| 2010 | 12.30 | 10.11 | 8.51 | 7.51 | 6.88 | 6.73 | 6.69 | 8.53 |
| 2011 | 12.10 | 10.20 | 8.79 | 7.91 | 7.39 | 7.17 | 7.05 | 8.55 |
| 2012 | 12.58 | 10.74 | 9.47 | 8.59 | 8.38 | 7.94 | 8.10 | 9.25 |
| 2013 | 12.99 | 11.28 | 10.03 | 9.17 | 9.14 | 8.93 | 8.54 | 9.78 |
| 2014 | 13.82 | 11.85 | 10.59 | 9.62 | 9.56 | 9.29 | 9.04 | 10.28 |
| 2015 | 13.38 | 12.22 | 10.92 | 10.04 | 9.78 | 9.54 | 9.24 | 10.53 |
| 2016 | 12.75 | 12.08 | 10.86 | 10.01 | 9.83 | 9.66 | 9.35 | 10.54 |
| 2017 | 14.00 | 12.60 | 11.00 | 10.49 | 10.44 | 10.24 | 9.21 | 10.92 |
| 2018 | 15.48 | 13.72 | 12.19 | 11.53 | 10.85 | 10.37 | 9.88 | 11.73 |
| 2019 | 16.71 | 14.89 | 13.51 | 12.56 | 11.86 | 11.34 | 11.39 | 12.90 |
| 2020 | 17.17 | 15.47 | 14.39 | 13.27 | 13.11 | 12.24 | 12.54 | 13.76 |
| 2021 | 17.99 | 16.25 | 15.75 | 14.30 | 14.08 | 13.84 | 14.18 | 15.08 |
| 2022 | 23.84 | 20.09 | 23.85 | 20.21 | 19.30 | 20.10 | 19.81 | 20.86 |
| 2023 | 32.28 | 32.76 | 32.17 | 29.04 | 27.07 | 23.04 | 22.08 | 27.20 |
| 2024 | 32.60 | 29.79 | 28.88 | 28.74 | 26.77 | 22.91 | 22.15 | 26.29 |
Note business elasticity prices listed above are in pence per kWh. And come from Gov.uk
Historic Business Electricity Index
The table below lists the annual price index of electricity sales to industrial consumers (excluding VAT) going all the way back to 1970. Q1 2010=100.
| Year | Electricity (Current fuel price index numbers) |
|---|---|
| 1970 | 8.40 |
| 1971 | 9.30 |
| 1972 | 9.50 |
| 1973 | 9.56 |
| 1974 | 13.04 |
| 1975 | 17.32 |
| 1976 | 20.02 |
| 1977 | 23.07 |
| 1978 | 25.38 |
| 1979 | 28.20 |
| 1980 | 34.78 |
| 1981 | 40.28 |
| 1982 | 44.12 |
| 1983 | 44.30 |
| 1984 | 44.22 |
| 1985 | 45.95 |
| 1986 | 46.41 |
| 1987 | 45.07 |
| 1988 | 47.51 |
| 1989 | 50.91 |
| 1990 | 50.80 |
| 1991 | 52.48 |
| 1992 | 55.39 |
| 1993 | 58.03 |
| 1994 | 55.93 |
| 1995 | 55.40 |
| 1996 | 53.49 |
| 1997 | 50.44 |
| 1998 | 49.97 |
| 1999 | 50.26 |
| 2000 | 46.60 |
| 2001 | 45.07 |
| 2002 | 44.14 |
| 2003 | 42.71 |
| 2004 | 46.42 |
| 2005 | 60.88 |
| 2006 | 80.98 |
| 2007 | 82.75 |
| 2008 | 101.77 |
| 2009 | 109.86 |
| 2010 | 100.00 |
| 2011 | 103.11 |
| 2012 | 108.04 |
| 2013 | 115.88 |
| 2014 | 120.80 |
| 2015 | 120.30 |
| 2016 | 121.21 |
| 2017 | 125.28 |
| 2018 | 131.27 |
| 2019 | 149.88 |
| 2020 | 154.59 |
| 2021 | 173.81 |
| 2022 | 244.42 |
| 2023 | 329.88 |
| 2024 | 323.54 |
Source Gov.UK
Sources & Methodology
Note the data above all comes from GOV.UK. They state the following:
Data in these tables shows quarterly and annual fuel prices for non-domestic consumers in the UK.
Data is shown excluding and including the Climate Change Levy (CCL) in current (cash) terms.
Quarterly and annual data back to 2004 are presented.
Data sources: